G. Khodabandelou, V. Gauthier, M. El-Yacoubi, M. Fiore
![]()
G. Khodabandelou, V. Gauthier, M. El-Yacoubi, M. Fiore, "Estimation of Static and Dynamic Urban Populations with Mobile Network Metadata", in IEEE Trans. on Mobile Computing, vol. 18 (9), pp. 2034-2047, 2018. 10.1109/TMC.2018.2871156
Abstract
Communication-enabled devices that are physically carried by individuals are today pervasive, which opens unprecedented opportunities for collecting digital metadata about the mobility of large populations. In this paper, we propose a novel methodology for the estimation of people density at metropolitan scales, using subscriber presence metadata collected by a mobile operator. We show that our approach suits the estimation of static population densities, i.e., of the distribution of dwelling units per urban area contained in traditional censuses. Specifically, it achieves higher accuracy than that granted by previous equivalent solutions. In addition, our approach enables the estimation of dynamic population densities, i.e., the time-varying distributions of people in a conurbation. Our results build on significant real-world mobile network metadata and relevant ground-truth information in multiple urban scenarios.
Dataset Columns
- grid id: the coordinate of the grid can be retrieved with the shapefile of a given city
- date: format Y-M-D H:M:S
- landuse label: the land use label has been computed by through method described in [2]
- population: Census population of a given grid block as definied by the Istituto nazionale di statistica ISTAT in 2011
- estimation: Dynamics density population estimation (in person) as the result of the method described in [1]
- area: surface of the "grid id" considered in km^2
- geometry: shape of the "grid id" considered with the EPSG:3003 coordinate system
Note
Due to legal constraints, we cannot share directly the original data from Telecom Italia Big Data Challenge we used to build this dataset.
Easy access to this dataset
Install the dataset repository
$ quilt install vgauthier/DynamicPopEstimate
Use the dataset with Panda Dataframe
>>> from quilt.data.vgauthier import DynamicPopEstimate
>>> df DynamicPopEstimate.rome()
>>> type(df)
<class 'pandas.core.frame.DataFrame'>
References
[1] G. Khodabandelou, V. Gauthier, M. El-Yacoubi, M. Fiore, "Population estimation from mobile network traffic metadata", in proc of the 17th International Symposium on A World of Wireless, Mobile and Multimedia Networks (WoWMoM), pp. 1 - 9, 2016. ArXiv, IEEE
[2] A. Furno, M. Fiore, R. Stanica, C. Ziemlicki, and Z. Smoreda, "A tale of ten cities: Characterizing signatures of mobile traffic in urban areas," IEEE Transactions on Mobile Computing, Volume: 16, Issue: 10, 2017.
![]()
Abstract
The power grid topologies listed in the present repository were obtained from the crowdsourcing project OpenStreetMap OSM. These data are fed in by users of the app and may be incomplete or even wrong. For this reason, topologies presented here should not be considered as exact representations of the real topologies, but rather as approximations. Results clearly depends on the data entered by the users.
There is a large gap between OSM data and a graphical representation of the power grid. Please refer to the SCIGRID project (http://scigrid.de) for more information.
References 
*F. Asgari, A. Sultan, H. Xiong, V. Gauthier, M. El-Yacoubi *, "CT-Mapper: Mapping Sparse Multimodal Cellular Trajectories using a Multilayer Transportation Network", Computer Communications, Special Issue on Mobile Traffic Analytics, 95, pp. 69-81, 2016.
Abstract
This repository contains the multimodal transportation network of Ile-de-France, it's modelled by graph layers corresponding each to a different transportation mode, interconnected together into a multilayer graph. The graph of the transport networks is provided under various format: graphml, gml, edge and vertex files format. The network is composed of three layers: the road network, the train network is a hybrid commuter rapid transit system in France serving Paris and its suburbs and the subway network. To build this graph, multiple geospatial datasets, namely the road network from the French National Geographic Institute (IGN) and the rail transport network (train and metro) from OpenStreetMap (OSM) were aggregated. Each node in the graph is either a road intersection, a rail station or a metro station. A key feature of the proposed multimodal transportation network is its modelling of transitions between different transport modes during a given trip. Cross-layer transition modelling is ensured by adding cross-layer edge between layers.
References 
Rachit Agarwal, Vincent Gauthier, Monique Becker, Thouraya Toukabrigunes, Hossam Afifi, "Large Scale Model for Information Dissemination with Device to Device Communication using Call Details Records", Compter Communication, 59, pp. 1 - 11, 2015.
Abstract
In a network of devices in close proximity such as Device to Device (D2D) communication network, we study the dissemination of public safety information at country scale. In order to provide a realistic model for the information dissemination, we extract a spatial distribution of the population of Ivory Coast from census data and determine migration pattern from the Call Detail Records (CDR) obtained during the Data for Development (D4D) challenge. We later apply epidemic model towards the information dissemination process based on the spatial properties of the user mobility extracted from the provided CDR. We then propose enhancements by adding latent states to the epidemic model in order to model more realistic user dynamics. Finally, we study dynamics of the evolution of the information spreading through the population.
Simulator
Usage
There are three different simulations available in this package:
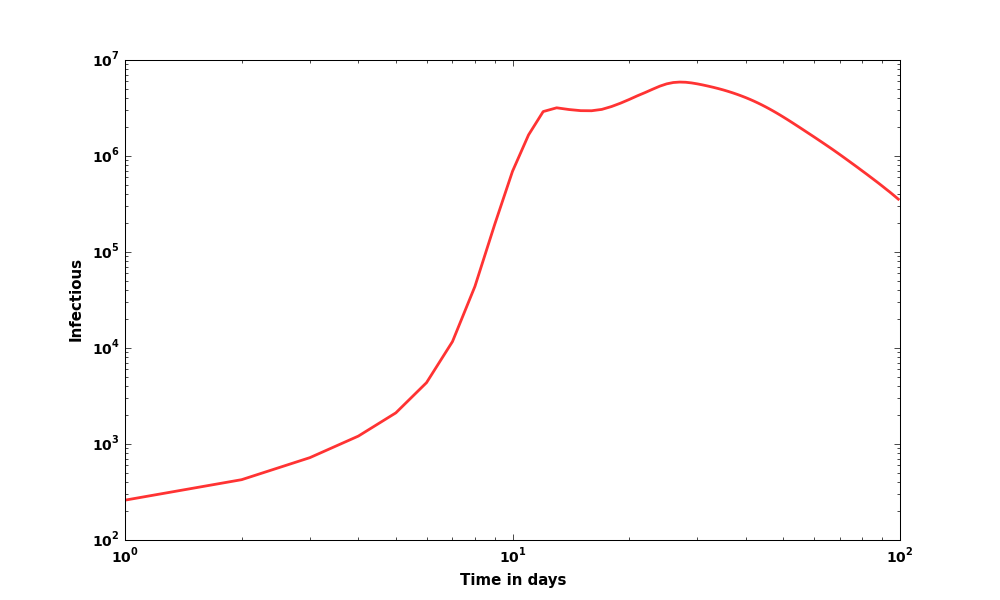
- simulation.py: is a simple SIR (Susceptible Infected Recovered) simulation
- simulation_latent.py: is a simple SIR simulation with latent states
- simulation_latent_heterogeneous.py: is a simple SIR simulation with latent states and heterogeneous return probability
Requirements
1. pyshp
2. progressbar
3. pickle
4. numpy
Install
$ tar zxvf archive.tar.gz
$ cd archive
$ pip install -r requirements.txt
Command line of the simulator
usage: simulation_latent_heterogeneous.py [-h]
                                          --output OUTPUT
                                          --duration DURATION
                                          [--tau TAU] [--mu MU]
                                          [--sim-id SIM_ID]
                                          [--cell-id CELL_ID]

Process SIR simulation with latent states and heterogeneous return probability.

optional arguments:
-h, --help           show this help message and exit
--output OUTPUT      output directory
--duration DURATION  simulation duration in days
--tau TAU            simulation step (fraction of day)
--mu MU              simulation mu for latent state (fraction of the
                     population)
--sim-id SIM_ID      simulation step (fraction of day)
--cell-id CELL_ID    initial cellID
Example of SIR Simulation with latent states
$ python simulation_latent.py --output ./output/latent/ --duration 7 --tau 0.1 --cell-id 0 --sim-id 1 --mu 0.3
Sample output of simulation.py as generated via plot.py file
Abhik Banerjee, Vincent Gauthier, Houda Labiod, Hossam Afifi
References
J. Zhang, V. Gauthier, H. Labiod, A. Banerjee, H. Afifi, "Information dissemination in vehicular networks via evolutionary game theory", In proc. of the IEEE International Conference on Communications (ICC), 2014.
Code used in the paper entitled : Cooperation Optimized Design for Information Dissemination in Vehicular Networks using Evolutionary Game Theory, 2012.
About
This python package an Agent Based Model used in [1] latest sources could be found at the following repository: GitHub for the latest source.
Toolbox
- Agent based model use in [1] in the simulation directory
- Various simulation examples used in [1] could be found in the example directory
- Human Based Mobility Models in the complex_systems directory
- Truncated Levy Flight Model [2]
You will need sphinx installed to generate the documentation. Documentation can be generated by running sphinx-build -b html . build/. Generated documentation can be found in the doc/build/html/ directory. Or consult the online documentation.
Testing
The easiest way to run the tests is to install nose (easy_install nose) and run nosetests or python setup.py test in the root of the distribution. Tests are located in the tests/ directory.
Example of mobility model obtain from a Truncated Levy flight model
References
J. Zhang, V. Gauthier, H. Labiod, A. Banerjee, H. Afifi, "Information dissemination in vehicular networks via evolutionary game theory", In proc. of the IEEE International Conference on Communications (ICC), 2014.
- Rhee I, Shin M, Hong S, Lee K, Chong S. On the Levy-Walk Nature of Human Mobility. IEEE Conference on Computer Communications (IEEE INFOCOM). 2008 .
References
M-H. Zayani , V. Gauthier, D. Zeghlache, "A joint model for IEEE 802.15.4 physical and medium access control layers", in proc. of the 7th International Wireless Communications and Mobile Computing Conference (IWCMC 2011). 2011.
Abstract
The m-file analyzes an Institute of Electrical and Electronics Engineers (IEEE) 802.15.4 Machine Access Control (MAC) layer channel in which multiple non-saturated stations compete for communicate with a sink. It is inspired from the IEEE 802.11 Model developed by David Griffith and Michael Souryal (Emerging and Mobile Network Technologies Group, Information Technology Laboratory, National Institute of Standards and Technology) derive from the work done by Park et al [2]. The objective behind this “adaptation” is to model a physical layer (PHY), including path loss and shadowing effects. The particularity of the proposed model lies in overstepping the node range disk shaped and taking into consideration the called “transitional area”. The model relies on the approach of Zuniga et al [3][4]. The function ZunPhyModel performs the calculations at the PHY level and determines the probability of good frame reception towards channel (signal-to-noise ratio) and radio (modulation and coding) setups.
References
- M.-H. Zayani, V. Gauthier, D. Zeghlache, "A joint model for IEEE 802.15.4 physical and medium access control layers", in proc. of the 7th International Wireless Communications and Mobile Computing Conference, 2011 .
- P. Park, P. Di Marco, P. Soldati, C. Fischione, J. KHenrik, "A generalized Markov chain model for effective analysis of slotted IEEE 802.15.4" in proc. of the IEEE 6th International Conference on Mobile Adhoc and Sensor Systems (MASS 2009), 2009.
- M. Zuniga, B. Krishnamachari, "Analyzing the transitional region in low power wireless links", In proc. of the First Annual IEEE Communications Society Conference on Sensor and Ad Hoc Communications and Networks (SECON 2004), 2004.
- Z. M. Zúñiga, B. Krishnamachari, "An analysis of unreliability and asymmetry in low-power wireless links", In ACM Transactions on Sensor Networks, vol. 3(2), pp 7 - 14, 2007.